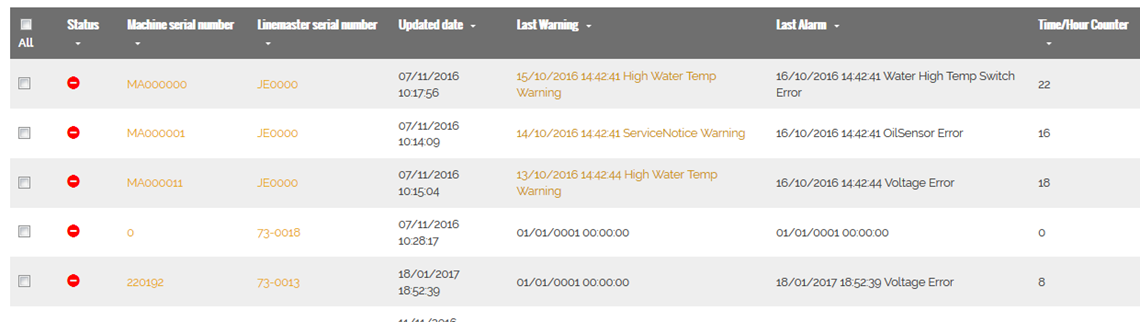
To enter a Machine diagnostic data you must click on the serial number of the Machine.
Now you enter this Machine and its data log.
You can select the date/time from/to, of the data you what to view.
In the data log there there are 2 preset charts: One concerning temperature and one concerning Warnings and alarms.
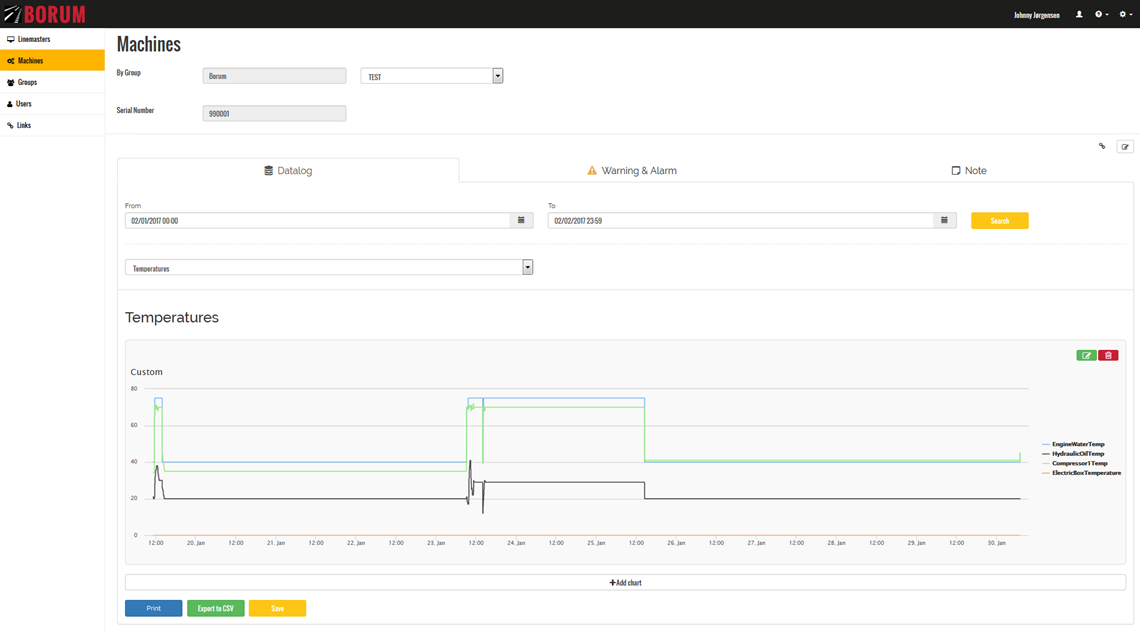
You can also make your own chart by clicking +ADD CHART
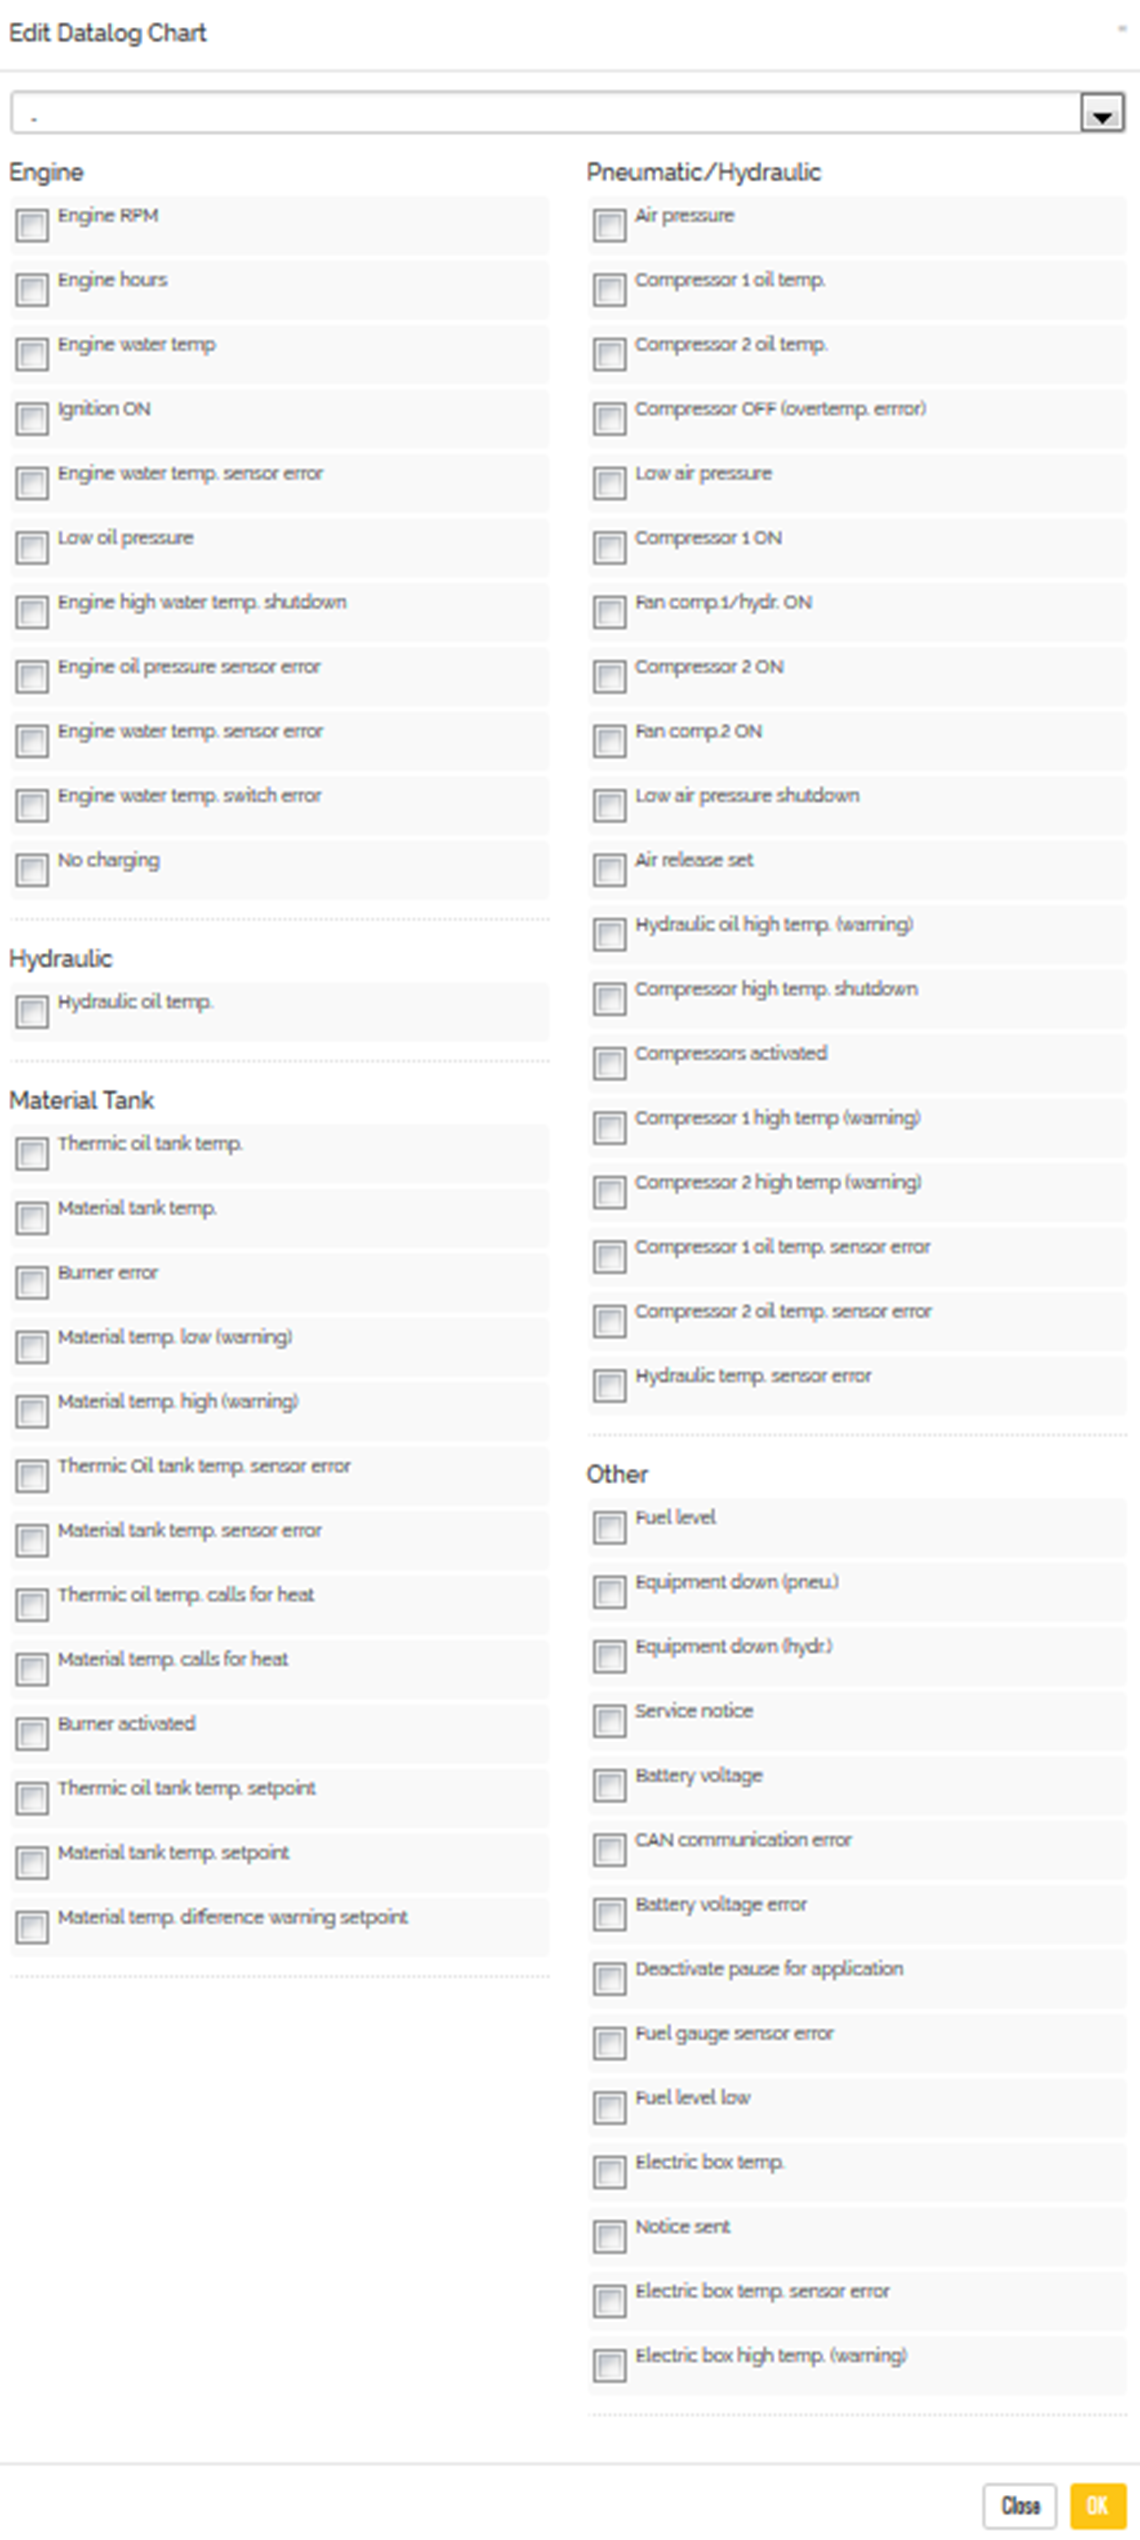
Now you just need to pick the diagnostic data you what in your chart.
Please notice: The data you can select, depends on the configuration of your machine. Therefore, some options might not be available to select.
For each chart you have the following options:
- Print it
- Export the data to a CSV file
- Save it, so you easy can access this chart again